Introduction
 Effective monitoring is vital for an application to monitor its performance and detect issues before they affect real users. In this context, we’ll utilize Grafana and Prometheus to oversee our performance, measuring key factors like Apdex Score, Throughput, Response Time, and overall user experience. This helps us to analyze application performance, understand how different components connect and communicate and identify performance bottlenecks
This guide will walk you through each tool step by step. You’ll discover how to collect data on how your application performs, use Node.js and Express for more detailed insights and create impressive visuals with Prometheus and Grafana. We’ll also explore Docker metrics, helping you translate them into valuable actions to enhance your app’s performance.
Pre-note: Dockerizing Your MERN Stack Application
Before adding metrics to your MERN stack containers, ensure your MERN application is Dockerized. If not, follow our comprehensive guide in Part1:Unlocking Performance Insights: Prometheus + Grafana for MERN Stack Applications.
Source — Code :
To-do: https://github.com/sentinelfoxinc/mern-todo-app/tree/master
Prometheus and Grafana : https://github.com/sentinelfoxinc/mern-todo-app/tree/part-2
Step 1: Configuring Docker Environment
1.1 Update docker-compose.yml:
Open your docker-compose.yml file add the configurations for Prometheus and Grafana and modify labels for backend and mongodb services:
version: '3'
services:
 mongodb:
   image: 'mongo'
   ports:
     - 27017:27017
   volumes:
     - data:/data/db # Mounts a volume named 'data' to store MongoDB data
   labels:
     - com.prometheus.scrape=true
     - com.prometheus.port=9100

 mongodb-exporter:
   image: bitnami/node-exporter:latest
   environment:
   - MONGODB_URI=mongodb://mongodb:27017
   ports:
   - 9100:9100
   deploy:
     resources:
       limits:
         memory: 128M
   depends_on:
      - mongodb

      prometheus:
   image: "prom/prometheus"
   ports:
     - "9090:9090"
   volumes:
     - ./prometheus:/etc/prometheus
     - ./prometheus/prometheus.yml:/etc/prometheus/prometheus.yml
   deploy:
     resources:
       limits:
         memory: 1G
   depends_on:
     - backend
     - mongodb

 grafana:
   image: grafana/grafana
   ports:
     - "3001:3000"
   volumes:
     - ./grafana:/var/lib/grafana
   environment:
     - GF_SECURITY_ADMIN_PASSWORD=password
     - PORT=8000
     - GF_USERS_ALLOW_SIGN_UP=false
   deploy:
     resources:
       limits:
         memory: 1G
   depends_on:
     - prometheus

   backend:

   build: ./backend # Builds the backend Docker image from the ./backend directory
   ports:
     - 8000:8000 # Maps port 80 of the container to port 80 of the host machine
   environment:
     - MONGO_URI=mongodb://mongodb:27017/to-do-list
     - JWT_SECRET=7h4t1ycbEUNUMQ8wnXWx8qB1MWiCQJxVGf # Random Key
   depends_on:
     - mongodb # Specifies dependency on the 'mongodb' service
   labels:
     - com.prometheus.scrape=true
     - com.prometheus.port=8000

frontend:

   build: ./frontend # Builds the frontend Docker image from the ./frontend directory
   ports:
     - 3000:3000 # Maps port 3000 of the container to port 3000 of the host machine
   environment:
     - BACKEND_HOST=backend
   depends_on:
     - backend # Specifies dependency on the 'backend' service

volumes:
 data: # Defines a named volume 'data' for MongoDB datata

1.2 Installing Node Exporter :
Modify Dockerfile in Backend , Frontend and MongoDB. Paste the Following Code in the Dockerfile
Backend :
FROM node

# Set working directory for the Node.js application
WORKDIR /app

# Install Node Exporter
RUN apt-get update && \
    apt-get install -y curl && \
    curl -LO https://github.com/prometheus/node_exporter/releases/download/v1.2.2/node_exporter-1.2.2.linux-amd64.tar.gz && \
    tar xvf node_exporter-1.2.2.linux-amd64.tar.gz && \
    cp node_exporter-1.2.2.linux-amd64/node_exporter /usr/local/bin/

# Copy package.json to the working directory
COPY package.json .

# Install Node.js dependencies
RUN npm install

# Copy the rest of the application files
COPY . .

# Expose ports for both Node.js app and Node Exporter
EXPOSE 8000
EXPOSE 9100


# Start both Node.js application and Node Exporter
CMD npm start & /usr/local/bin/node_exporter
Frontend :
# Use the Node.js base image
FROM node

# Set working directory for the Node.js application
WORKDIR /app

# Install Node Exporter
RUN apt-get update && \
    apt-get install -y curl && \
    curl -LO https://github.com/prometheus/node_exporter/releases/download/v1.2.2/node_exporter-1.2.2.linux-amd64.tar.gz && \
    tar xvf node_exporter-1.2.2.linux-amd64.tar.gz && \
    cp node_exporter-1.2.2.linux-amd64/node_exporter /usr/local/bin/

# Copy package.json to the working directory
COPY package.json .

# Install Node.js dependencies
RUN npm install

# Copy the rest of the application files
COPY . .

# Expose ports for Node.js app and Node Exporter
EXPOSE 3000
EXPOSE 9100

# Start Node.js application and Node Exporter
CMD npm start & /usr/local/bin/node_exporter

Create a Dockerfile inside the folder where your docker-compose.yml file exists.
Node Exporter for MongoDB :
# Use the official MongoDB image as the base
FROM mongo

# Install necessary packages for Node Exporter
RUN apt-get update && apt-get install -y wget && apt-get install -y lsof && apt-get install -y net-tools

# Download and install Node Exporter
RUN wget https://github.com/prometheus/node_exporter/releases/download/v1.2.2/node_exporter-1.2.2.linux-amd64.tar.gz && \
    tar -xzf node_exporter-1.2.2.linux-amd64.tar.gz && \
    cp node_exporter-1.2.2.linux-amd64/node_exporter /usr/local/bin/ && \
    rm -rf node_exporter-1.2.2.linux-amd64*


# Expose Node Exporter's default port
EXPOSE 9100


# Start Node Exporter when the container starts
CMD ["node_exporter"]

1.3 Docker Compose and Set Up Prometheus.yml file :
Execute docker-compose up command in the directory where your docker-compose.yml file resides
Confirm that the prometheus and grafana folders are generated in the same directory as your docker-compose.yml file.
create prometheus.yml in the Prometheus Folder
Step 2 : Adding Hostnames to Docker Compose Services
2.1 Modify the docker-compose.yml file to include explicit hostnames for the frontend, backend, and MongoDB services.
hostname: mymongodb
hostname: mybackendhostname
hostname: myfrontendhostname

2.2 Configuring Targets in prometheus.yml
Paste the Following Code in prometheus.yml
global:
 scrape_interval: 15s

scrape_configs:
 - job_name: 'frontend'
   static_configs:
     - targets: ['myfrontendhostname:9100'] # Targets for scraping metrics from the frontend container on port 9100
 - job_name: 'backend'
   static_configs:
     - targets: ['mybackendhostname:8000', 'mybackendhostname:9100'] # Targets for scraping metrics from the backend container on ports 8000 and 9100
 - job_name: 'mongodb'
   static_configs:
     - targets: ['mymongodb:9100'] # Target for scraping metrics from the MongoDB service/container on port 9100

#Node exporter - 9100
#Node js and express js - 8000
Ensure you’ve saved the modifications made to the prometheus.yml file. and execute docker-compose up

Ensure that all the necessary containers for your services (Frontend, Backend, MongoDB, Prometheus and Grafana) are up and running.
2.3 Access localhost:9090 in your web browser to reach the Prometheus web UI. Navigate to “Targets” in status

Verify if the defined hostnames (e.g., myfrontendhostname, mybackendhostname, mymongodb) display as UP
Step 3: Visualizing with Grafana
3.1 Utilize Grafana to import specific dashboards for enhanced visualization and monitoring.
- Access
localhost:3001to reach the Grafana web UI - Log in to Grafana using the username ‘admin’ and password ‘password’.
- Go to “Connections ” on the left sidebar Click on “Data Sources” Choose “Add new data source” Select “Prometheus”.
- In the URL field, enter
"http://host.docker.internal:9090". Adjust other settings if needed (e.g., Name, Access, etc.). Click “Save & Test” to ensure connectivity.

3.2 Importing Dashboards:
- Select “Dashboard” choose “new“and click “Import” .
- Node Exporter dashboard — ID: 1860
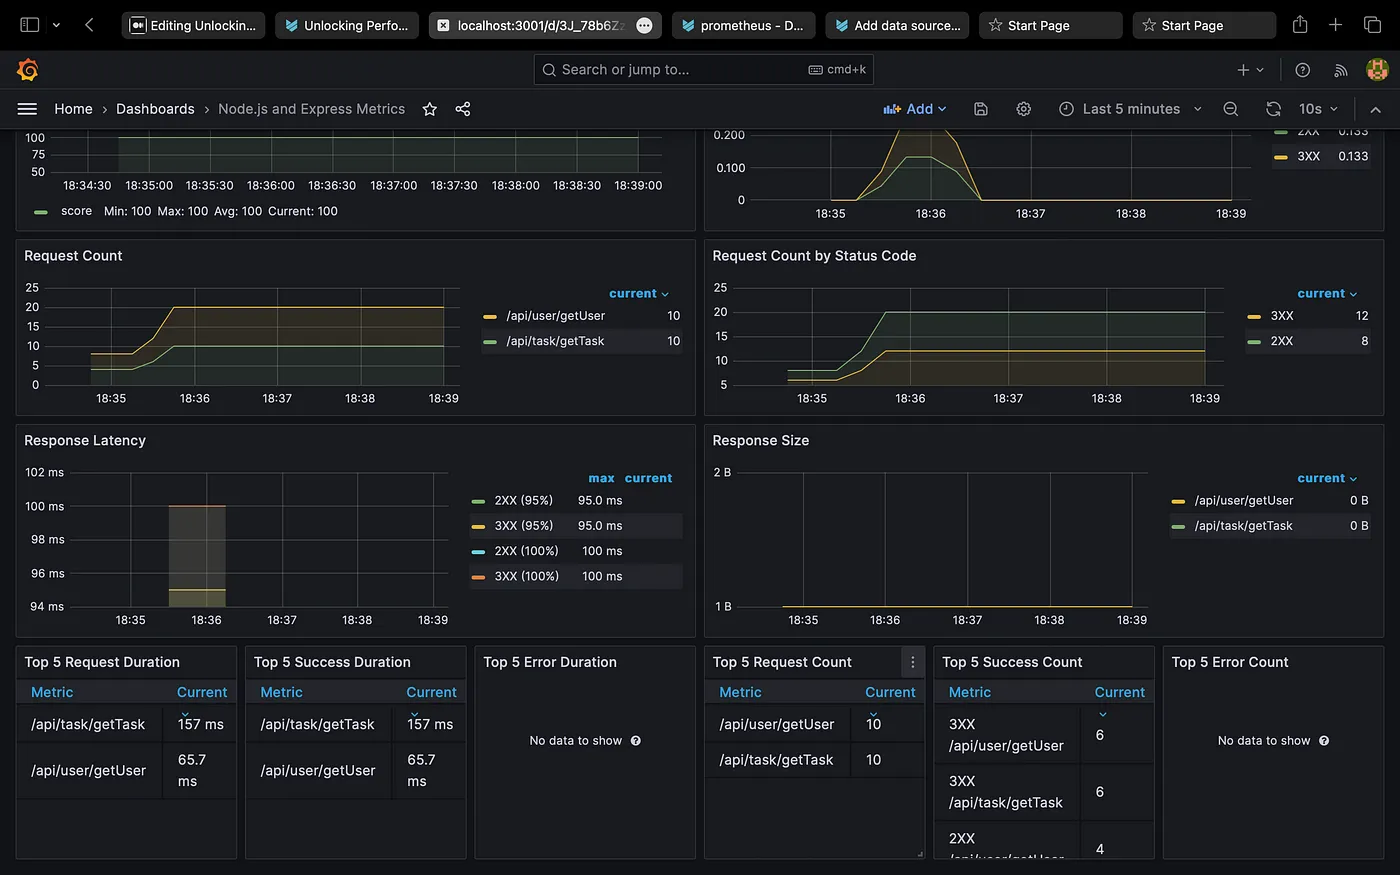
- Node.js and Express Metrics Dashboard — ID : 14565
Node Exporter:

NodeJs & Express Metrics:

Conclusion
This two-part guide has illuminated the crucial role of Prometheus and Grafana in efficient monitoring for MERN stack applications, presenting a holistic solution for measuring essential performance indicators. The step-by-step walkthrough empowers users not only to collect but also to analyze performance data, encompassing Apdex score, Throughput, and Response time, facilitating the identification of potential bottlenecks. Empowered with these tools and insights, developers are well-equipped to optimize their application’s performance, ensuring a seamless and efficient user experience.